Unrealised Capital Gains & Losses

Overview
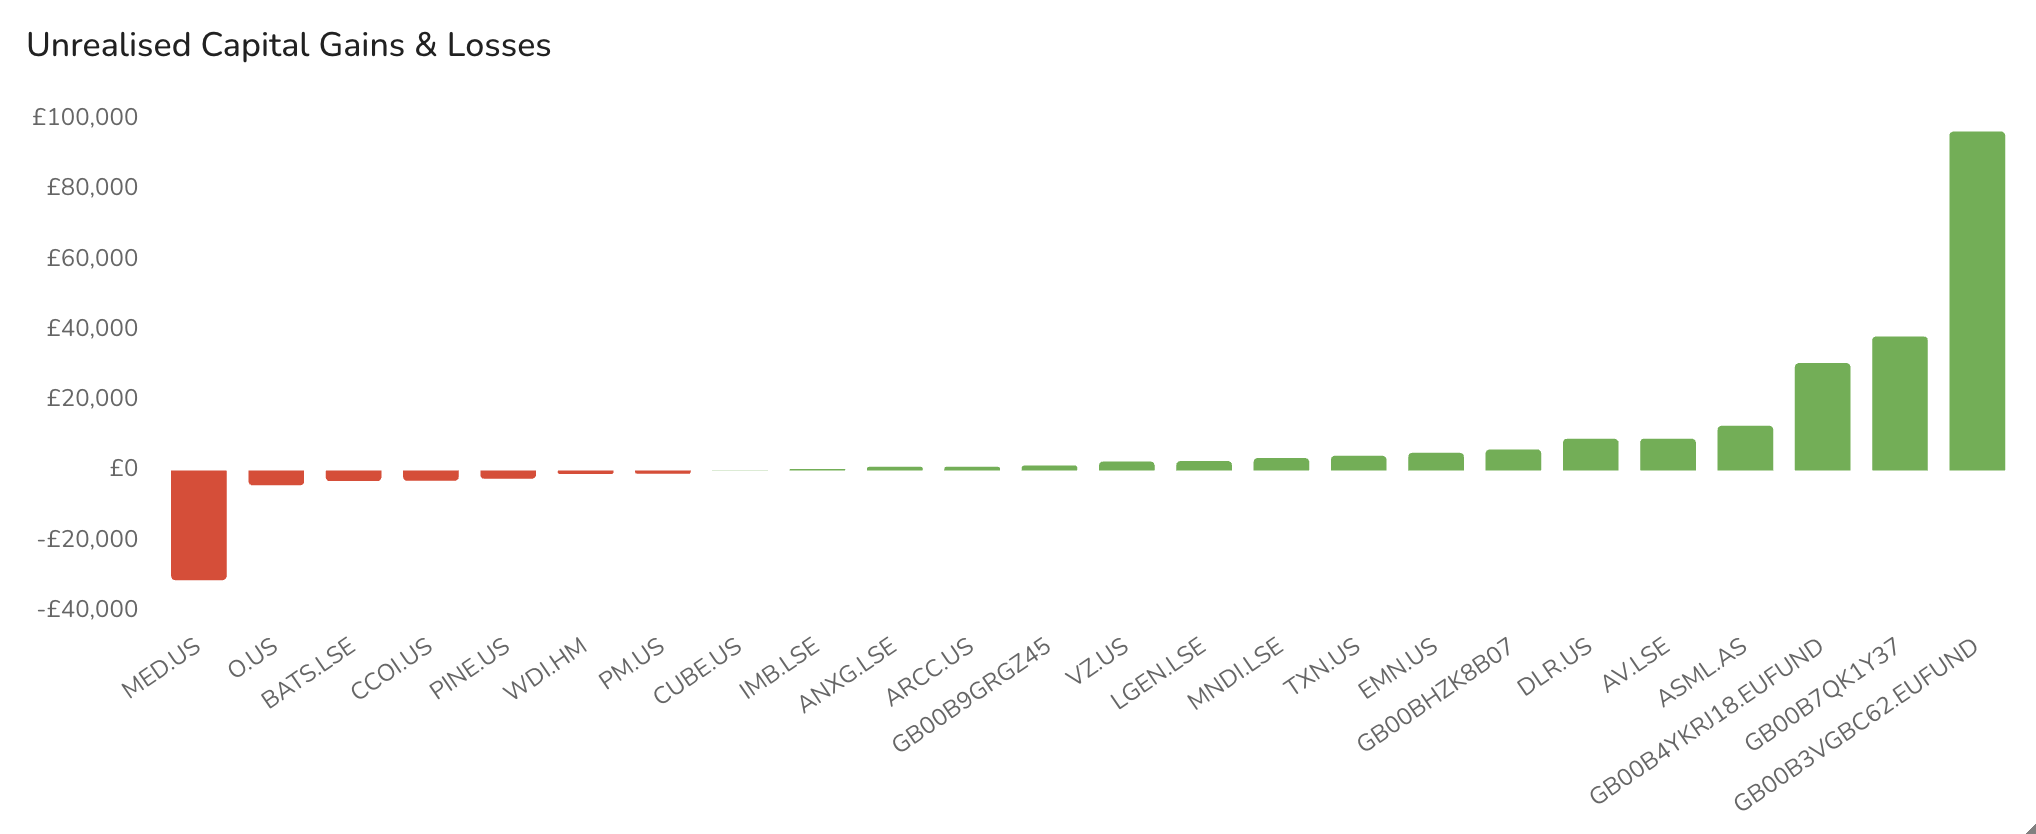
The Unrealised Capital Gains & Losses Widget provides a visual representation of the potential profit or loss of each stock in your portfolio that has not yet been realized. It helps investors to see at a glance which holdings are performing well and which are underperforming. The widget displays data in a clear bar chart format, making it easy to compare the unrealized gains and losses across different holdings.
This widget does not have configurable settings, and the data displayed is based on the current market value of each stock compared to its purchase price.
Data Displayed
- Unrealised Capital Gain or Loss:
- Unrealised Gain: Occurs if the current market value of a stock is higher than its purchase price, indicating potential profit if the stock is sold.
- Unrealised Loss: Occurs if the current market value of a stock is lower than its purchase price, indicating potential loss if the stock is sold.
- The values are represented in a bar chart, with gains typically shown in green and losses in red.
Tooltip Explanation
- Unrealised Capital Gain or Loss: This bar chart displays the unrealized capital gain or loss for each stock in your portfolio. An unrealized gain occurs if the current market value is higher than the purchase price, while an unrealized loss is indicated if the market value is lower. These values represent potential profit or loss that is not realized until the stocks are sold.
Example Data Representation
- Each bar in the chart corresponds to a stock in your portfolio.
- The length of the bar indicates the magnitude of the unrealized gain or loss.
- The color of the bar indicates whether the value is a gain (green) or a loss (red).